
MerekaiBIMAP V2
Reveal what data hides: design thematic maps ready to share, without needing GIS experience.

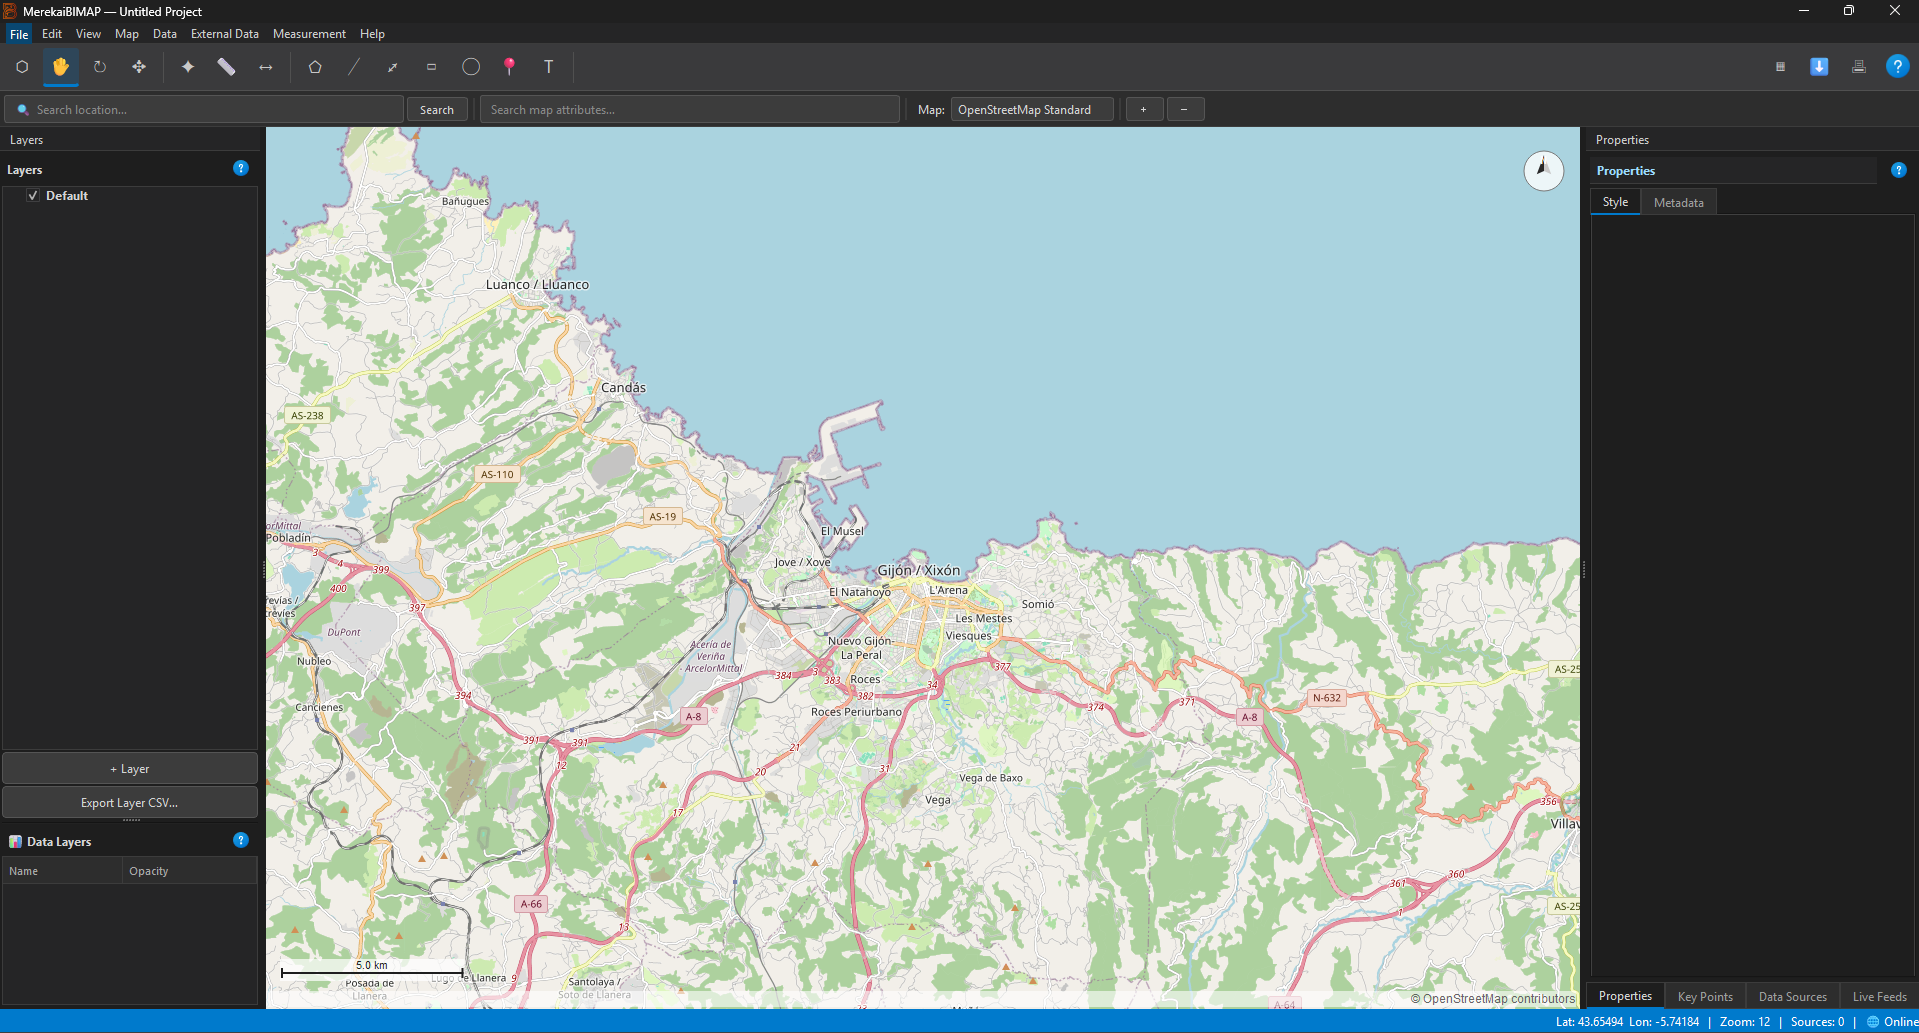
The landscape has something to say
Some decisions only make sense when we see where they happen. MerekaiBIMAP V2 turns location-based data into clear thematic maps and presentation-ready PDF documents: a more direct way to move from a spreadsheet to an informed conversation about a place.
It is not intended to replace specialist analysis or GIS teams. Its ambition is different: to give more people a practical way to explore and communicate geographic data, and spend less time wrestling with tools they do not need for every task.
The problem is not a lack of data, but making it understandable
Geographic data can get trapped in spreadsheets, hard-to-read formats and specialised tools. This creates a gap between having information and being able to use it: a spatial pattern may be present in the data without ever reaching a meeting, report or decision-maker.
Reducing that gap can improve the quality of a conversation. A map does not make decisions for us, but it can help reveal relationships, test hypotheses and share a common understanding of a problem.
A tool for giving data visual form
The desktop application creates data-based maps and exports them as PDFs. Its workflow brings cartographic design closer to analysts, researchers, consultants and public administrations that need to communicate spatial information without turning every assignment into a full GIS project.
Its value is not in promising automatic answers, but in making it easier to ask a better question: what is happening, where, and how can we explain it clearly?
Value for the team
- Turns spatial data into a visual output that is easy to share.
- Lowers the barrier to entry compared with specialist mapping workflows.
- Helps prepare materials for meetings, reports and presentations.
- Desktop application built with Python and PyQt6.
- User, development and build documentation in Spanish and English.
Ideal for
Analysis, consulting, research and organisational teams that need to explain geographic patterns accessibly. From a spatial assessment to a results presentation, a map can bridge data and the people it matters to.
From a useful prototype to a tool that fits your context
Every organisation works with different data, mapping criteria and audiences. I can help assess the workflow, adapt the experience and define a visual output for your needs, validating the result with the people who know the data.
What story will your data tell when we put it on a map?
If you have a specific spatial need, we can explore it rigorously and turn it into a useful, maintainable and understandable tool for your team.
Explore the code and documentation · Read the manual
FOUND THIS INTERESTING?
Share it with your professional network.